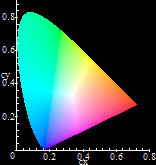
CIE x,y chromaticity diagram, generated with Maple.
In this article the author uses the spectral distribution data of the elements from NIST ([6]), simulates the emission spectra of some typical lamps and finally derives several interesting conclusions about some lighting engineering applications which use these lamps. The conclusions are reached entirely theoretically. That is, although some data comes from published sources which contain experimental data, this article contains no physical experimentation data. All processing and all graphical visualization is done by a computer program. The reached conclusions are in general agreement with commercially published sources, such as those of lamp manufacturers and lighting engineers. CAUTION: Note that the accuracy of the conclusions on this article depends upon [6]'s published spectral distribution data and the assumptions made in sections 13 and 14, therefore it is advisable to read section Possible NIST Inaccuracies carefully and the author's Copyright & Disclaimer before perusing any of the data below. Atomic elements with a question mark next to their names are (obvious) suspects for inaccuracies.
The best light for general and specific illumination is sunlight and daylight. Whenever such light is not available, lighting engineers strive to create light sources which mimic daylight or light sources with light as close to daylight as possible (or with other different attributes, depending on the application). Because the perception of color of light sources is subjective, lighting engineers usually characterize the "appearance" of light sources based on their chromaticity. To help understand chromaticity, color science and illumination in general better, in 1931 the International Commission on Illumination (CIE) introduced one of the first mathematically defined color spaces, the CIE x,y chromaticity diagram.
Chromaticity for light sources is generally defined in two ways: by Correlated Color Temperature (CCT) (related to the color produced by a Black Body radiator), or by their CIE x and y coordinates. These two methods give a measure of the color appearance of the source itself. By using this diagram as a reference, many aspects of color become clarified and lighting engineers can investigate various light sources. Usually the major lamp manufacturers publish both definitions in order to give the consumer an idea of how well the lamp performs. Another key notion which lately is also published by manufacturers is the Color Rendering Index (CRI), which gives a measure of how well colors appear under light from a given light source. The relationship between all three factors, chromaticity, CCT and CRI is very complex. In general chromaticity does not relate directly to CRI. Light sources with similar chromaticities may have greatly different color rendering properties and vice versa. Light engineering is a fascinating science, perhaps the most important science after mathematics, because it is ultimately connected with our ability to process data around us using vision, which is the most important human sense. Without it we would not be able to do our work during the day in places which are not reached by natural light and during the night when there is no strong natural illumination. Because light engineering is tied to color perception, extensive research in various interconnected branches such as physics, spectroscopy, chemistry, the science of color and psychology has been performed and continues being performed. Light engineering is and will continue to be an active research area pursued aggressively by most major lamp manufacturers, because very few (if any) people have no need for artificial light sources.
A preliminary mathematical analysis which explains the first part of the mapping between signals in the time domain and human brain processing, is presented in [42]. The rest of this document analyzes the second part of the visual mapping, that between brain and actual color sensation. To visualize the spectral distributions and colors of all the elements and of various light sources, the author has created a Maple program which inputs a spectral distribution of arbitrary resolution and automatically generates a visual distribution with 1nm resolution like the one to the right on the table below. For lines closer than 1nm together in the input data the author simply added their respective relative intensities, since this is pretty much what happens with visual spectroscopes as well. The program calculates several additional useful parameters, such as the source's CCT in Kelvins (when applicable), CIE coordinates x,y and Photoshop R,G,B coordinates for the source used and a Full-Spectrum index, FS (see [34] and [35]). The R,G,B Photoshop values were used to render the source hues of the color squares, left of the corresponding spectra. The color rendering algorithms were based on [1] and [11], but adjusted to use [31]'s CIE 1931 2-deg XYZ Color Matching Function table with a 1nm resolution:
The CCT algorithm was based on [2] and [10]. The author chose the CIEsystem in [1] with a γ=2.5 because it gave the best colors on his LCD laptop screen. Element spectral distribution data was taken from [6]. Other data was based on the rest of the references and on extensive discussions with engineering specialists and Maple experts which have taken place in the usenet newsgroups sci.engr.lighting and comp.soft-sys.math.maple, in which the author participates often. The program can additionally display custom distributions, distributions of combinations of elements with different contributions, distributions with a maximum from 0-100%, UV and IR distributions and chromaticity diagrams. Emissions in the UV and IR whenever shown are shown as grey. For most distributions, the author chose the range 380nm to 700nm, because most people are not able to discern colors outside this range and additionally outside this range the computer cannot represent colors accurately. Furthermore, the XYZ Color Matching Functions used, have values very close to zero for wavelengths outside this range. All the diagrams on this page were created by the program automatically.
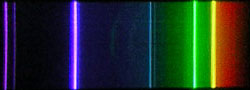
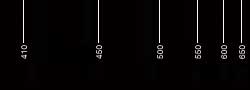
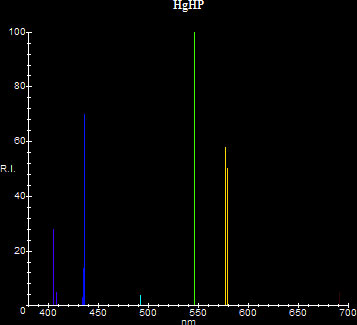
Generally speaking there are two ways to visualize spectra: By using one-dimensional representations/photographs or by using two dimensional plots. Each has advantages and disadvantages over the other. One-dimensional representations/photos are simply linear scans through the required spectral area with (Rλ,Gλ,Bλ) being the color at wavelength λ. This representation suffers from the fact that stronger lines need to be represented by brighter colors and/or wider lines, in order to give an indication of their strength relative to weaker lines. It is however closer to true images of spectra as seen through spectroscopes. Two-dimensional plots are often created by professional spectrographs and have the spectrum plotted as a histogram consisting of the data points (λ,f(λ)), where λ is the wavelength and f(λ) is the relative intensity (or the energy in mW/nm) of the lines. This has the advantage that the relative strength is shown easily and the resolution stays constant as lines close together don't merge. Two-dimensional plots are always linear with respect to wavelength, whereas real photos can be either linear or non-linear. If the spectroscope uses a prism for example, the resulting spectrum will be non-linear. If it uses a grating, the spectrum will be linear. In this document the author renders two-dimensional representations of spectra, primarily because the author has already devoted considerable time photographing real one-dimensional spectra in [25]. If you want to see more interesting one-dimensional renderings, see [40]. Here is the spectrum of a high pressure mercury lamp using the two different methods. The real spectrum (on the left) is non-linear with respect to wavelength, as it was produced by a prism. On this spectrum the two yellow lines of mercury merge together, because the camera does not have enough resolution to separate them.
| One-dimensional Spectrum | Two-dimensional Spectrogram |
  |
 |
Generally speaking, the "friendliest" light to human vision is light produced by incandescent matter or as engineers call it, light emitted by Black Body radiators. This is no coincidence: First, the sun is a Black Body radiator so natural sunlight is such light. Second, primitive man had only fire at his disposal which again emits such light. Unfortunately man-made Black Body radiators (such as fire or candle flames) cannot reach temperatures comparable to that of the sun. So, although technically their light is pleasing and warm, it lacks severely in the blue and violet part of the visual spectrum. As a result, blue and violet colors are not rendered correctly under such man-made lights and appear dull and dark. Fortunately, fire and candles are examples at the extreme end of the spectrum (literally!). Newer man-made light sources, such as incandescent lamps are Black Body radiators which operate at higher temperatures and are able to render colors better. A measure of how well Black Body radiators render colors, is their actual radiating temperature, which is usually denoted in degrees Kelvin. Candle flames and fire radiate approximately at T=1020K. Incandescent light bulbs operate at around 2100K to 2700K depending on Wattage. Halogen incandescent lamps operate at still higher temperatures, sometimes reaching 3100K. Although all incandescent lamps produce very pleasing light to the eye, most of their energy is radiated in the infrared part of the spectrum. This can be explained theoretically by looking at Planck's Law and Wien's Displacement Law for Black Bodies, which shows where the maximum of emission occurs. Specifically for the temperatures of most man-made Black Body light sources (with the exception of nuclear explosions!), the maximum occurs at infrared. Here are then some examples of spectra produced by Black Body radiators, for different temperatures. The table below is sorted numerically by Black Body temperature for convenience. It consists of four columns: A column showing the Black Body temperature in Kelvins, a column showing the source's chromaticity CIE coordinates and CCT in Kelvins, a column showing the approximate color of the source in Photoshop R,G,B and a final column showing the visible spectral distribution. The CCT is shown as calculated by the Maple program. Theoretically CCT=T for Black Bodies, however programmatically these are not always in agreement, so they may display some minor disagreement. Note that when T is small (<~4000) the maximum emission occurs in the infrared. As T increases, the maximum moves into the visible and then into UV, so the overall source color changes from red-orangish to white and finally bluish-white. When T becomes very large (which for practical purposes can be taken as infinity) the color shifts to bluish.
| T (K) | CIE chromaticity CCT (K) |
Source Color | Spectral Distribution |
| 1000 (~candle/fire [32]) |
x=0.65083 y=0.34631 CCT:N/A |
 |
.jpg) |
| 2000 | x=0.52592 y=0.41383 CCT:2009 |
 |
.jpg) |
| 3000 (tungsten halogen lamp) |
x=0.43644 y=0.40430 CCT:3010 |
 |
.jpg) |
| 4000 | x=0.37988 y=0.37681 CCT:4016 |
 |
.jpg) |
| 5000 | x=0.34416 y=0.35137 CCT:5035 |
 |
.jpg) |
| 6000 | x=0.32054 y=0.33099 CCT:6079 |
 |
.jpg) |
| 7000 | x=0.26011 y=0.32647 CCT:7165 |
 |
.jpg) |
| 8000 | x=0.29214 y=0.30243 CCT:8308 |
 |
.jpg) |
| 9000 | x=0.28310 y=0.29233 CCT:9521 |
 |
.jpg) |
| 10000 | x=0.27607 y=0.28410 CCT:10824 |
 |
.jpg) |
| ∞ | x=0.076966 y=0.23344 CCT:N/A |
 |
.jpg) |
The best quality light is of course daylight. Although the sun is a Planckian radiator, its spectrum is not continuous. The sun's photosphere emits a continuous Black Body spectrum at T~5785 but the chromosphere contains many elements which absorb several discrete wavelengths according to their emission spectrum below and Kirchhoff's Law, so the spectrum of the light that reaches us is an absorption spectrum. The most prominent elements in the chromosphere are H, Na, O, Fe, Mg and Ca. The ratio of the elements in the program was adjusted to simulate absorption lines of approximately the correct intensity. The sun's spectrum along with the sun's chromaticity and color are given in the following table. The CCT calculated by the Maple program is slightly different than the sun's T=5785, because the absorption lines are taken into account.
| T (K) | CIE chromaticity CCT (K) |
Source Color | Spectral Distribution |
| 5785 | x=0.32551 y=0.33513 CCT:5822 |
 |
.jpg) |
Black Body radiators are also called Planckian radiators (because of Planck's Law). As T increases continuously, the chromaticity coordinates x,y of a Planckian radiator form a certain curved locus on the CIE diagram, called The Planckian Locus. This locus in shown in grey superimposed on the CIE diagram below. The leftmost point of the locus corresponds to T=infinity.
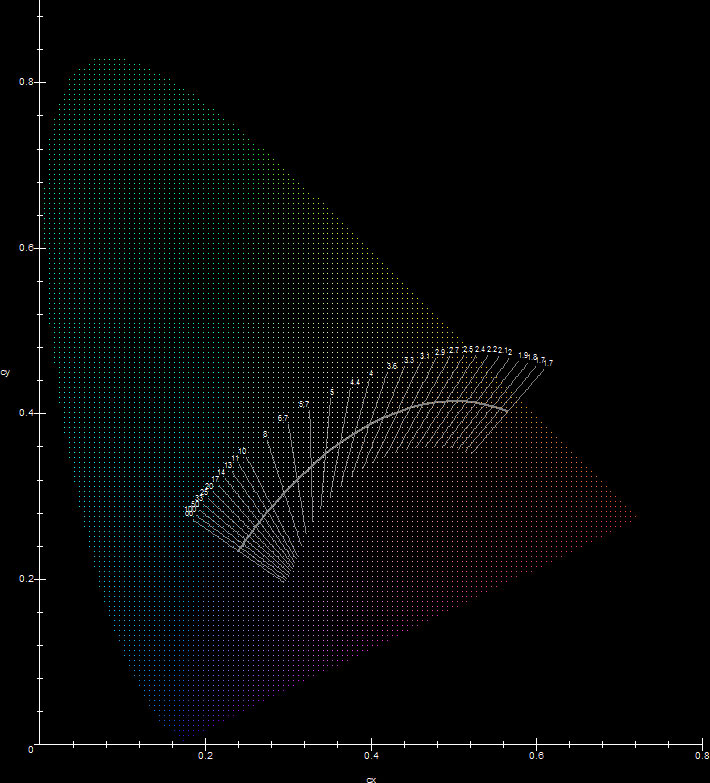
The proximity of a source's chromaticity to the Planckian Locus is a fairly good indicator of a light source's overall color quality. If a source's chromaticity coordinates x,y fall close to the Planckian Locus, this indicates that the source's color is close to the color of a Black Body radiator of a certain T, corresponding to the point on the locus in a certain direction from the source's chromaticity coordinates. This direction is usually indicated by a line which crosses the locus, called an isothermal line (also called a Judd line. See [8]). For an artificial light source or a non-Planckian radiator, this T is defined to be the CCT of the source. In general, the closer a source's chromaticity to the Planckian Locus, the more accurate the correspondence between it and a Planckian radiator of temperature T=CCT is. Two sources lying on the same isothermal line have the same CCT, however the source which lies closer to the Planckian Locus between the two approximates a Black Body radiator better. If the chromaticity lies far way from the locus, such a correspondence is fairly meaningless. To make sure that this correspondence makes sense, in addition to the CCT, engineers also publish the source's CRI. Without the CRI, the CCT may exist but it may make little sense, as one can see later.
Because engineers cannot construct Planckian radiators of temperatures close to that of the sun, alternative approaches have been considered, which essentially rely on exploiting the non-equilibrium electromagnetic radiation emitted by various elements when these are excited electrically. Since the main energy source we have is electricity, the latter is used to power artificial light sources which contain trace quantities of selected elements. The selection and suitability of these elements is a science in and of itself, often involving physics, quantum mechanics, chemistry, electromagnetism and spectroscopic analysis. Contrary to Black Bodies whose emission spectrum is continuous (because it is a probability distribution) and characterized only by their temperature T, the elements have characteristic and unique emission spectra, with discrete emission lines. Below you see a table with the emission spectra of all the elements. Elements which are missing either do not exist in sufficient quantities to warrant spectral examination or do not display emission lines in the range used in this document (380nm-700nm). All elements are normalized with respect to their strongest line which is shown as 100% (in some cases the maximum emission occurs near the edges of visibility, so the rest of the spectrum appears suppressed). The table below is sorted alphabetically for convenience. It consists of four columns: A column showing the standard element name, a column showing the source's chromaticity CIE coordinates and CCT in Kelvins, a column showing the approximate color of the source in Photoshop R,G,B and a final column showing the visible spectral distribution. The author stresses again that the results depend on [6]'s published data. See section Possible NIST Inaccuracies.
| Element | CIE chromaticity CCT (K) |
Source color | Spectral Distribution |
| Ac(?) | x=0.20202 y=0.03128 CCT:N/A |
 |
.jpg) |
| Ag | x=0.20673 y=0.57568 CCT:8015 |
 |
.jpg) |
| Al | x=0.29828 y=0.56321 CCT:6150 |
 |
.jpg) |
| Am | x=0.34847 y=0.21336 CCT:2774 |
 |
.jpg) |
| Ar | x=0.30165 y=0.14112 CCT:N/A |
 |
.jpg) |
| As | x=0.16085 y=0.74540 CCT:7865 |
 |
.jpg) |
| Au | x=0.28176 y=0.21370 CCT:52792 |
 |
.jpg) |
| Ba | x=0.40594 y=0.29390 CCT:2465 |
 |
.jpg) |
| Be | x=0.65307 y=0.28337 CCT:N/A |
 |
.jpg) |
| Bi | x=0.13799 y=0.08132 CCT:N/A |
 |
.jpg) |
| Bk(?) | x=0.25865 y=0.48376 CCT:7372 |
 |
.jpg) |
| Br | x=0.42538 y=0.17141 CCT:N/A |
 |
.jpg) |
| C | x=0.48870 y=0.40603 CCT:2310 |
 |
.jpg) |
| Ca | x=0.30381 y=0.25900 CCT:8820 |
 |
.jpg) |
| Cd | x=0.42421 y=0.34372 CCT:2671 |
 |
.jpg) |
| Ce | x=0.37811 y=0.51844 CCT:4673 |
 |
.jpg) |
| Cf(?) | x=0.22770 y=0.36738 CCT:10822 |
 |
.jpg) |
| Cl | x=0.33398 y=0.14900 CCT:5924 |
 |
.jpg) |
| Cm(?) | x=0.33030 y=0.13171 CCT:5453 |
 |
.jpg) |
| Co | x=0.16760 y=0.09322 CCT:N/A |
 |
.jpg) |
| Cr | x=0.15269 y=0.18140 CCT:N/A |
 |
.jpg) |
| Cs | x=0.43610 y=0.24066 CCT:N/A |
 |
.jpg) |
| Cu | x=0.22108 y=0.47286 CCT:8660 |
 |
.jpg) |
| Dy | x=0.18242 y=0.04908 CCT:N/A |
 |
.jpg) |
| Er | x=0.24165 y=0.15290 CCT:N/A |
 |
.jpg) |
| Es(?) | x=0.13603 y=0.77698 CCT:8096 |
 |
.jpg) |
| Eu | x=0.21064 y=0.17438 CCT:N/A |
 |
.jpg) |
| F | x=0.70108 y=0.29868 CCT:N/A |
 |
.jpg) |
| Fe | x=0.16540 y=0.23953 CCT:N/A |
 |
.jpg) |
| Ga | x=0.71666 y=0.28028 CCT:N/A |
 |
.jpg) |
| Gd | x=0.17851 y=0.11031 CCT:N/A |
 |
.jpg) |
| Ge | x=0.31803 y=0.37803 CCT:6033 |
 |
.jpg) |
| H | x=0.36142 y=0.17779 CCT:1800 |
 |
.jpg) |
| He | x=0.40332 y=0.30023 CCT:2593 |
 |
.jpg) |
| Hf | x=0.22803 y=0.21893 CCT:N/A |
 |
.jpg) |
| Hg | x=0.22581 y=0.17240 CCT:N/A |
 |
.jpg) |
| Ho | x=0.21480 y=0.11149 CCT:N/A |
 |
.jpg) |
| I | x=0.44470 y=0.45205 CCT:3230 |
 |
.jpg) |
| In | x=0.15847 y=0.02011 CCT:N/A |
 |
.jpg) |
| Ir | x=0.18189 y=0.10689 CCT:N/A |
 |
.jpg) |
| K | x=0.24400 y=0.41540 CCT:8644 |
 |
.jpg) |
| Kr | x=0.31527 y=0.25843 CCT:7358 |
 |
.jpg) |
| La | x=0.32204 y=0.48980 CCT:5755 |
 |
.jpg) |
| Li | x=0.65307 y=0.28337 CCT:N/A |
 |
.jpg) |
| Lu | x=0.23161 y=0.22856 CCT:N/A |
 |
.jpg) |
| Mg | x=0.22430 y=0.38397 CCT:10422 |
 |
.jpg) |
| Mn | x=0.17279 y=0.07516 CCT:N/A |
 |
.jpg) |
| Mo | x=0.24775 y=0.30775 CCT:12498 |
 |
.jpg) |
| N | x=0.50463 y=0.41109 CCT:2182 |
 |
.jpg) |
| Na | x=0.56646 y=0.42639 CCT:1784 |
 |
.jpg) |
| Nb | x=0.18991 y=0.14174 CCT:N/A |
 |
.jpg) |
| Nd | x=0.23373 y=0.24045 CCT:276889 |
 |
.jpg) |
| Ne | x=0.32614 y=0.300694 CCT:5874 |
 |
.jpg) |
| Ni | x=0.17530 y=0.29671 CCT:51135 |
 |
.jpg) |
| Np | x=0.58908 y=0.39726 CCT:N/A |
 |
.jpg) |
| O | x=0.56255 y=0.38729 CCT:N/A |
 |
.jpg) |
| Os | x=0.18210 y=0.07952 CCT:N/A |
 |
.jpg) |
| P | x=0.37811 y=0.58559 CCT:4817 |
 |
.jpg) |
| Pa(?) | x=0.65398 y=0.29507 CCT:N/A |
 |
.jpg) |
| Pb | x=0.24353 y=0.12610 CCT:N/A |
 |
.jpg) |
| Pd | x=0.18926 y=0.18234 CCT:N/A |
 |
.jpg) |
| Pm | x=0.21557 y=0.12110 CCT:N/A |
 |
.jpg) |
| Po | x=0.18962 y=0.16608 CCT:N/A |
 |
.jpg) |
| Pr | x=0.26716 y=0.34978 CCT:8796 |
 |
.jpg) |
| Pt | x=0.208396 y=0.21666 CCT:N/A |
 |
.jpg) |
| Pu(?) | x=0.33160 y=0.30768 CCT:5531 |
 |
.jpg) |
| Ra(?) | x=0.30080 y=0.47820 CCT:6277 |
 |
.jpg) |
| Rb | x=0.29209 y=0.19641 CCT:N/A |
 |
.jpg) |
| Re | x=0.19441 y=0.18127 CCT:N/A |
 |
.jpg) |
| Rh | x=0.18520 y=0.09060 CCT:N/A |
 |
.jpg) |
| Rn | x=0.18304 y=0.03589 CCT:N/A |
 |
.jpg) |
| Ru | x=0.16337 y=0.076314 CCT:N/A |
 |
.jpg) |
| S | x=0.39692 y=0.30582 CCT:2806 |
 |
.jpg) |
| Sb | x=0.39856 y=0.55907 CCT:4452 |
 |
.jpg) |
| Sc | x=0.30733 y=0.29512 CCT:7263 |
 |
.jpg) |
| Se | x=0.17640 y=0.18539 CCT:N/A |
 |
.jpg) |
| Si | x=0.53341 y=0.42437 CCT:2013 |
 |
.jpg) |
| Sm | x=0.16931 y=0.15183 CCT:N/A |
 |
.jpg) |
| Sn | x=0.57260 y=0.40128 CCT:N/A |
 |
.jpg) |
| Sr | x=0.18553 y=0.20712 CCT:N/A |
 |
.jpg) |
| Ta | x=0.33978 y=0.26127 CCT:4750 |
 |
.jpg) |
| Tb | x=0.17519 y=0.06473 CCT:N/A |
 |
.jpg) |
| Tc | x=0.17048 y=0.13381 CCT:N/A |
 |
.jpg) |
| Te | x=0.51420 y=0.45161 CCT:2354 |
 |
.jpg) |
| Th | x=0.22492 y=0.21358 CCT:N/A |
 |
.jpg) |
| Ti | x=0.16351 y=0.15584 CCT:N/A |
 |
.jpg) |
| Tl | x=0.19299 y=0.78151 CCT:7247 |
 |
.jpg) |
| Tm | x=0.19167 y=0.09032 CCT:N/A |
 |
.jpg) |
| U | x=0.25803 y=0.13296 CCT:N/A |
 |
.jpg) |
| V | x=0.21169 y=0.07884 CCT:N/A |
 |
.jpg) |
| W | x=0.21324 y=0.28430 CCT:27407 |
 |
.jpg) |
| Xe | x=0.46306 y=0.36183 CCT:2266 |
 |
.jpg) |
| Y | x=0.21561 y=0.14833 CCT:N/A |
 |
.jpg) |
| Yb | x=0.22844 y=0.28922 CCT:19073 |
 |
.jpg) |
| Zn | x=0.28944 y=0.19738 CCT:N/A |
 |
.jpg) |
| Zr | x=0.21275 y=0.13814 CCT:N/A |
 |
.jpg) |
Here are all the element colors arranged into a periodic table (idea and html code for table courtesy of Matt Roberds).
.jpg) |
.jpg) |
||||||||||||||||
.jpg) |
.jpg) |
B | .jpg) |
.jpg) |
.jpg) |
.jpg) |
.jpg) |
||||||||||
.jpg) |
.jpg) |
.jpg) |
.jpg) |
.jpg) |
.jpg) |
.jpg) |
.jpg) |
||||||||||
.jpg) |
.jpg) |
.jpg) |
.jpg) |
.jpg) |
.jpg) |
.jpg) |
.jpg) |
.jpg) |
.jpg) |
.jpg) |
.jpg) |
.jpg) |
.jpg) |
.jpg) |
.jpg) |
.jpg) |
.jpg) |
.jpg) |
.jpg) |
.jpg) |
.jpg) |
.jpg) |
.jpg) |
.jpg) |
.jpg) |
.jpg) |
.jpg) |
.jpg) |
.jpg) |
.jpg) |
.jpg) |
.jpg) |
.jpg) |
.jpg) |
.jpg) |
.jpg) |
.jpg) |
* | .jpg) |
.jpg) |
.jpg) |
.jpg) |
.jpg) |
.jpg) |
.jpg) |
.jpg) |
.jpg) |
.jpg) |
.jpg) |
.jpg) |
.jpg) |
At | .jpg) |
| Fr | .jpg) |
** | Rf | etc. | |||||||||||||
| * | .jpg) |
.jpg) |
.jpg) |
.jpg) |
.jpg) |
.jpg) |
.jpg) |
.jpg) |
.jpg) |
.jpg) |
.jpg) |
.jpg) |
.jpg) |
.jpg) |
.jpg) |
||
| ** | .jpg) |
.jpg) |
.jpg) |
.jpg) |
.jpg) |
.jpg) |
.jpg) |
.jpg) |
.jpg) |
.jpg) |
.jpg) |
Fm | Md | No | Lr | ||
All the spectrum renderings and color hues above depend on [6]'s published data. It seems that sometimes the data published contain subtle inaccuracies so things are not as simple as picking the data and plugging them in the program. For example, [6] warns about some of the dangers here. Similarly, source [4] brought to the author's attention the following excerpts from [6]:
In view of the above comments, the reader should expect several color rendering inaccuracies above, when [6] cites more than one source in the corresponding spectral distributions or when the element's lines are of equal intensity (as in radioactive elements with a question mark next to them). The author chose to keep the NIST distributions as they are, in order to have a single consistent source of data. Should a better source come along, the author will recalculate all the results.
The main problem with the elements when engineers consider them as artificial light sources, is that their spectra do not contain all the wavelengths in the visual spectrum, so adjustments need to be made, by utilizing combinations of elements or fluorescence. What's worse, not only they do not contain all the wavelengths of a continuous spectrum, they have wildly varying CCTs and CRIs and the emission spectrum may change when the discharge temperature or pressure is changed. Assuming NIST's data come from a non-specialized standard low pressure element discharge, the following figure shows the distribution of all the elements' chromaticities plotted against the CIE diagram and gives a general idea of how useful their emission spectrum is.
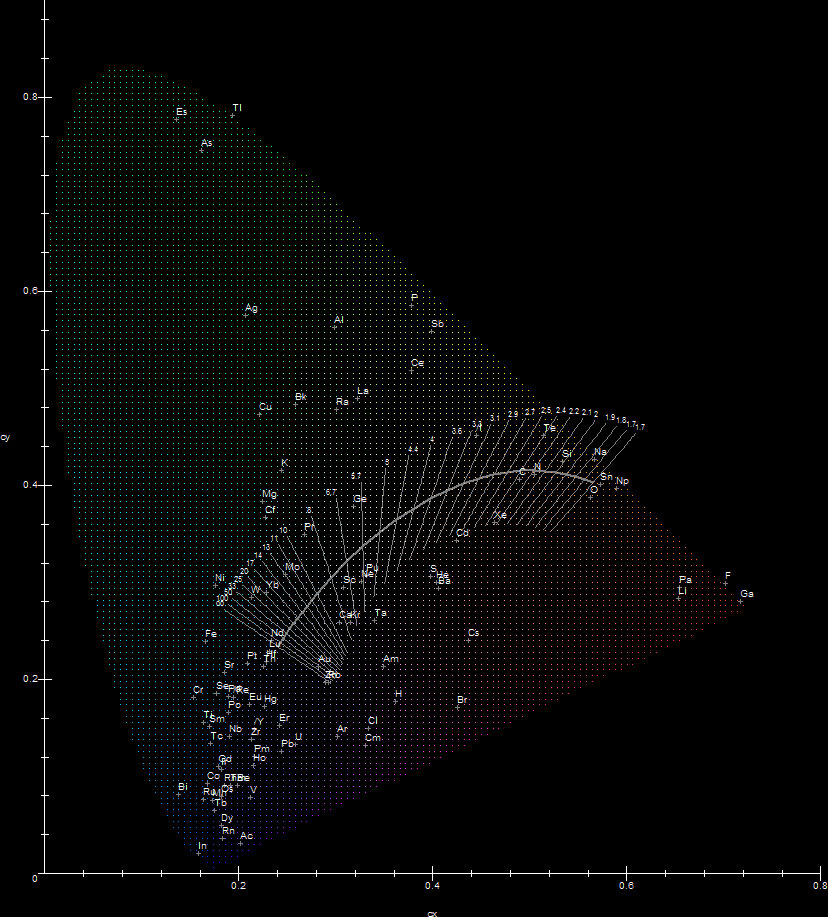
In general the physics of lamp discharges is extremely complicated, so selecting elements as discharge ingredients for lamps is hard science! First, from the above diagram for example, it is fairly obvious that most elements make bad candidates for light production, because of bad CCTs/CRIs. As far as chromaticity is concerned there are some good candidates: O, C, N, P, Xe, Na, W and Sc among others. It turns out however that this is only one of the factors that determine discharge element suitability. Other factors such as heat conductivity, vapor pressure, corrosiveness of hot vapor and toxicity are very important and usually limit the choices of lighting engineers even more. For example, the selection of the discharge tube material which is used to confine the discharge in a lamp in an efficient way is extremely important. It requires very advanced material technology because many elemental vapors at high temperature will corrode the confining discharge tube very fast, making practical lamp construction impossible. The two most used elements in lamp discharges are mercury, which is the main ingredient in fluorescent lamps, mercury vapor lamps and metal halide lamps, and sodium, which is the main ingredient in low and high pressure sodium lamps. The most often used material for discharge tubes is fused quartz and aluminum oxide. Mercury for example is relatively inert and when it is the main ingredient in a discharge, its vapor won't corrode quartz. Other elements are not this friendly to quartz. Hot sodium will corrode quartz tubes, so high pressure sodium lamp discharge tubes are made of translucent aluminum oxide (polycrystalline alumina). This material has a lower transparency than quartz (~95%) but withstands the hot sodium vapor. Other materials such as zirconium or sapphire have been considered but were abandoned because they were expensive. The advantages of using mercury and sodium (which often are not found in other elements) are:
Mercury (source [4]):
Sodium (source [4]):
Other elements (source [5]):
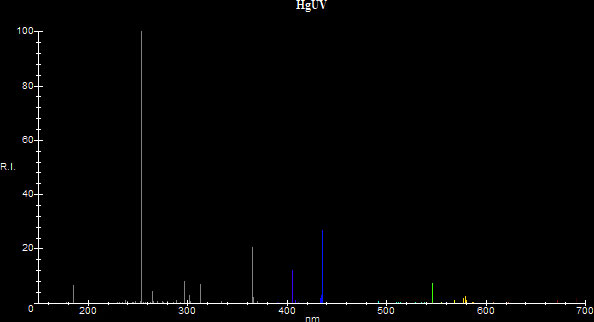
Although mercury ended up as being one of the best candidate for lamps, in a low pressure discharge it emits most of its radiation in the UV:
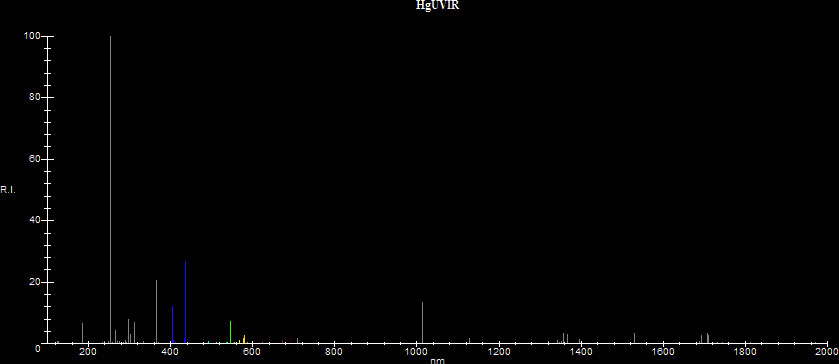
Most of the energy (~78%) is radiated at the resonance line at 253.7nm. The discharge also radiates significant energy at 365nm, at 184.9nm and at various other UV lines. These lines are usually utilized by various lamp manufacturers for different reasons. The 253.7nm line for example is strongly bacteriocidal, so low pressure mercury lamps with a clear glass with very low iron oxide content, which allow this line to pass through are used as germicidal lamps in hospitals, warehouses, barbershops and wherever else bacterial disinfection is required, such as for water purification and disinfection. The 184.9nm line converts O2 to O3, more commonly known as ozone, so low pressure mercury lamps which allow this line through are used to sanitize air. Although ozone is toxic in high concentrations, the concentrations achieved by small ozone lamps are usually not high enough to become toxic. In general caution should be exercised with high concentrations of ozone.
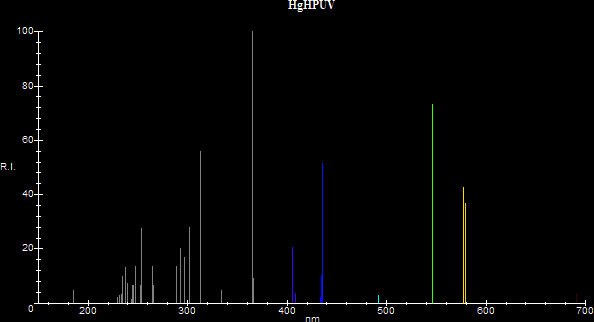
When the pressure in a mercury vapor discharge increases, the spectrum of the mercury discharge is altered significantly: The maximum emission moves from the 253.7nm resonance line to the 365nm 3P°-3D non-resonance line. The 253.7nm line becomes greatly suppressed and approximately half the energy is now radiated at the 365nm line. The intensities of the visible lines increase and they contribute to the visible spectrum with different ratios than when under low pressure. There is also broadening of the spectral lines and emission of some continuum (sources [23], [25], [30]) Consequently the efficiency and color temperature of the discharge are changed dramatically. The efficiency changes from a mere 10-12 lm/W to a decent 52 lm/W, so a lamp employing a high pressure mercury discharge becomes practical as a source for general illumination. The source's new chromaticity allows for a determination of CCT which is around 6000K-7000K (sources [3], [7], [16], [18], [19], [30]) and the source shifts its color from blue to greenish white moving closer to the Planckian Locus. However, although the CCT is good, the CRI of a high pressure mercury vapor lamp is not very good and reds are muted appearing as dull browns/greys because the spectrum lacks in red emissions. Here is a comparison between the two types of discharges in the range 150nm to 700nm. The data was based on [9], [19] and [23], although the data in [9] is conflicting with the data in the other two references. [19] lists a CCT of 6300K and (x,y)=(0.315,0.385) for its 1000 Watt clear mercury vapor lamp, which are close to what the program calculated for the high pressure distribution.
| Discharge Type | CIE chromaticity CCT (K) |
Source Color | Spectral Distribution |
| Low Pressure |
x=0.22581 y=0.17240 CCT:N/A |
|
 |
| High Pressure | x=0.31996 y=0.38645 CCT:5942 |
.jpg) |
 |
Because most of the energy with both low and a high pressure mercury lamps is radiated in the UV, engineers harness the two lines, the 253.7nm line in low pressure and the 365nm line in high pressure to increase the efficiency of lamps which use these two types of discharges. Harnessing the 253.7nm line in a low pressure lamp results in the fluorescent lamp. Harnessing the 365nm line results in the color corrected mercury vapor lamp. In both technologies, UV high energy photons excite special phosphors which absorb those photons and then re-emit photons of lower energy in the visible by fluorescence, improving the CCT of the source in both cases. Generally there are three types of phosphors: Halophosphate phosphors and triphosphors used with fluorescent lamps and mercury vapor color correction phosphors.
Considerable improvement also occurs when the light of mercury lamps or color corrected mercury lamps is combined with a planckian radiator's light. This is the main principle behind blended light lamps, which use an incandescent filament in series with the mercury burner to simultaneously limit the current of the lamp and provide warm planckian radiation at around 2500K (sources [22], [30]). As these lamps do not require any support gear, they are often used as retrofit lamps in regular incandescent installations with excellent results, replacing the relatively yellowish light of regular incandescents with crisp, whiter light, although the combined efficiency of both radiators is relatively low, so their use is somewhat sparse.
In all cases above where fluorescence occurs, Stokes' Shift is applicable. This means, λFluorescence>λStimulation. Here then is a comparative table for the two types of mercury discharge in the visible range 380nm to 700nm, employed by the popular triphosphor fluorescents, the color corrected mercury vapor lamps and the blended light lamps, with spectra simulated by adjusting the line intensity of all sources using the Maple program:
| Lamp Type | CIE chromaticity CCT (K) |
Source Color | Spectral Distribution |
| Low Pressure Mercury |
x=0.22581 y=0.17240 CCT:N/A |
 |
.jpg) |
| Triphosphor Fluorescent 2700K |
x=0.46632 y=0.42547 CCT:2724 |
 |
.jpg) |
| Triphosphor Fluorescent 4000K |
x=0.37820 y=0.37264 CCT:4031 |
 |
.jpg) |
| Clear Mercury Vapor |
x=0.31996 y=0.38645 CCT:5942 |
 |
.jpg) |
| Color Corrected Mercury Vapor |
x=0.40288 y=0.39424 CCT:3582 |
 |
.jpg) |
| Blended Light | x=0.41436 y=0.39733 CCT:3362 |
 |
.jpg) |
The technological descendant of the mercury discharge is the metal halide discharge. In this discharge halides of selected metals are added to the mercury discharge to improve the quality of generated light by shifting the chromaticity of the corresponding lamp closer to the Planckian Locus. The halides are easy to vaporize and this generally guarantees relatively high source efficiencies. During normal operation the discharge reaches temperatures of around 700°C. At this temperature the vapor pressure of the halides is a few milligrams of mercury. Close to the discharge axis the halides break down to their corresponding constituent metal and halogen and the metal vapor enters the arc stream where it participates in light production. Away from the discharge axis and close to the tube walls the metals recombine with halogen and again form halides which condense there in liquid form. This mechanism ensures two good things: That the corresponding metals in the halides participate almost exclusively in the light production (which would be impossible if they were put in the discharge tube in pure form) and that the discharge tube is not chemically attacked by them. Because the electrodes need to also be chemically unaffected by the halides, they are often constructed from metals which are immune to chemical attacks (such as thorium oxide). The previous fact along with the facts that there's always trace quantities of hydrogen in the tube (halides are hygroscopic) and that the electron emission rate of such electrodes is lower than that of tungsten electrodes, necessitate much higher starting voltages than regular mercury vapor lamps. As a result their support gear is relatively expensive and these lamps either require a separate thyristor ignitor or ballasts which deliver higher peak voltages, depending on type (source [23]). Two main halide technologies exist, the European technology and the American technology:
By combining the corresponding element distributions, it's possible to simulate the most common metal halide discharge spectra. Here's a comparative table of some metal halide lamp spectra rendered with the Maple program. For the visualization and all subsequent calculations and sections the author assumed the following:
To conclude: Although the results of section Element Emission Spectra may contain inaccuracies, the assumptions on this and the subsequent sections seem to generally be on the safe side. This side seems to be partially supported by the fact that there existed specific ratios of the elements which gave the required chromaticities and CCTs for all the combinations below (therefore the assumptions must indeed have been accurate). The results for the calculations of CCTs and chromaticities in general agree with the published data the author has at his disposal (such as [3], [15]-[19], [22]-[23] and [25]), so the program can conceivably be used as a predictor for the efficiency of various discharges. Alternatively, custom spectral distributions of halides (at the correct vapor pressure) may be entered giving even better results. Some rather rare metal halide types are shown towards the bottom of the table. On some spectra the author has suppressed the maximum intensity shown, in order to show the weaker lines.
| Lamp Type | CIE chromaticity CCT (K) |
Source Color | Spectral Distribution |
| Sodium/Thallium/Indium metal halide (European) |
x=0.37426 y=0.41000 CCT:4366 |
 |
.jpg) |
| Sodium/Scandium metal halide (American) |
x=0.35185 y=0.32282 CCT:4575 |
 |
.jpg) |
| Dysprosium/Thallium /Thulium/Caesium "daylight" (European) metal halide |
x=0.30179 y=0.35347 CCT:6855 |
 |
.jpg) |
| Plant growing metal halide |
x=0.36054 y=0.27794 CCT:3629 |
 |
.jpg) |
| Blue colored metal halide |
x=0.21958 y=0.15021 CCT:N/A |
 |
.jpg) |
| Green colored metal halide |
x=0.26600 y=0.57411 CCT:6748 |
 |
.jpg) |
| Iron/Cobalt diazo metal halide |
x=0.29973 y=0.28898 CCT:8051 |
 |
.jpg) |
| Lead/Gallium diazo metal halide |
x=0.2953 y=0.27545 CCT:9022 |
 |
.jpg) |
Sodium is the second most important candidate for light production. An electrical discharge through sodium vapor is generally quite efficient because sodium has its resonance lines in the visible, at D1=589nm and D2=589.6nm. Such a discharge can take generally two forms, depending on pressure. Under low pressure (0.004 milligrams of mercury) and when the tube wall temperature is approximately 265°C most of the energy is dissipated at the D lines, so such a source has very high efficiency (180-210 lm/W for the highest Wattages available (source [30])), because the wavelengths of the D line are close to the wavelength where the eye has its maximum sensitivity (555nm). Under high pressure things are much more complex. Generally the optimal pressure of sodium in a high pressure discharge is around 100-200 millimeters of mercury, when the temperature of the coldest spot in the discharge tube is around 700°C. However the temperature of the hottest spot on the discharge tube can reach temperatures of 1200°C. At such high temperatures, sodium corrodes most available materials that try to contain it, so the technology that allowed mass construction and use of high pressure lamps took a while to emerge. The breakthrough came with the creation and testing of a polycrystalline alumina (see Lamp Engineering), which was impervious to hot sodium corrosion. Under high pressure, the sodium D lines suffer thermal/pressure broadening and the D line suffers self-absorption. In addition, additional energy is radiated at several other secondary lines which in a low pressure discharge are very weak (the intensity ratio between the second strongest sodium line and D is roughly 0.7%, see [25]). This transforms the spectrum from a virtually monochromatic source under low pressure to a non-monochromatic source, therefore minor perception of color is possible. The majority of the radiation however is still produced by the self-reversed D line's "wings" (the wavelengths around the absorption feature which produce continuous radiation), so the discharge attains a golden-yellow color. Although the CCT of a low pressure discharge is essentially meaningless because its light is monochromatic, the high pressure discharge attains a CCT of 1800K-2500K depending on Wattage and pressure. Color rendering is generally bad, since most colors past green are muted. The efficiency is lower than that of the low pressure discharge and is in the vicinity of 100-110 lm/W. The two types of the sodium discharge are simulated below. The high pressure discharge has been approximated using a Lorentzian distribution, which usually describes thermally broadened lines quite accurately. The intensities of all lines other than D have been increased to account for thermal/pressure broadening. As such they appear more intense than in the distributions found in [16],[18] and [19].
| Lamp Type | CIE chromaticity CCT (K) |
Source Color | Spectral Distribution |
| Low Pressure | x=0.56646 y=0.42639 CCT:1784 |
 |
.jpg) |
| High Pressure (source [19]) |
x=0.50257 y=0.39664 CCT:2104 |
 |
.jpg) |
Xenon is the third most important candidate for light production. Generally the xenon discharge takes three different forms depending on the power load used to excite the gas. Under low to medium pressure with low voltage and amperage its spectrum is rich but contains many lines in the red which lowers its CCT to non-acceptable levels for general illumination. Considerable improvement occurs when xenon at medium pressure is discharged with high voltage, in which case ions II and III (and possibly IV and V depending on voltage) participate in the light production by producing hundreds of new lines which raise the CCT of the discharge, shifting the color of the source towards cool daylight. Because the spectrum of xenon from this type of discharge is well-balanced and has a high CCT and CRI, it is used in flash tubes to mimic daylight when taking photographs. The third type of xenon discharge manifests when xenon has a pressure between 30 and 100 atmospheres and is discharged with a high current density. Xenon lamps employing this kind of discharge have very short arcs, operate on regulated DC and have extremely high brightness (100k cd/cm2 at wattages higher than 6 kW). Their CCT in the neighborhood of 5600K-6300K is excellent (sources [3], [15]) and their spectrum is almost continuous. Their efficiency is around 40 lm/W, but the advantage of having a very good daylight spectrum and a good CCT overweighs this shortcoming, as a result they are employed in large cinema projectors (replacing the now obsolete carbon arc lamps), in search beacons and display spotlights, whenever light of very high quality is required. However they are expensive, their support gear is complicated and they are also dangerous because they operate under very high pressures, so they are usually operated only in enclosed fixtures and only by qualified personnel.
| Lamp Type | CIE chromaticity CCT (K) |
Source Color | Spectral Distribution |
| Low pressure Low voltage Low amperage (Xe I) |
x=0.46306 y=0.36183 CCT:2266 |
 |
.jpg) |
| Medium pressure High voltage Low amperage (Xe I-V, Flash tube) |
x=0.28998 y=0.28435 CCT:9185 |
 |
.jpg) |
| High pressure Low voltage High amperage (Short arc) (data from [29], and [33] mathematically weighed by the author) |
x=0.31971 y=0.31096 CCT:6225 |
 |
.jpg) |
As stated in the abstract, the calculations in this document assume a fairly naive interpretation of [6]'s published spectral distribution data and the assumptions made in sections 13 and 14, therefore it is advisable to read again section Possible NIST Inaccuracies. That is: that the energy dissipated in all low pressure spectra is concentrated according to relative line strength. Further, most of the high pressure discharge spectral profiles described in the sections above for Mercury, Metal Halide, Sodium and Xenon, take for granted that the majority of the lines in the corresponding spectra are infinitely thin even at high pressures and temperatures. While the former (energy dissipated in proportion to line strength) is a tacit assumption that works fairly well with the subsequent engineering calculations, the latter should not be and needs to be detailed further. The line profile of most lines in element spectra changes drastically under conditions of higher temperature and pressure. The most important change occurs because of thermal/pressure broadening and self-absorption.
When these changes are taken into account, we obtain a much more accurate spectral profile for the lamps involved, which can be used to aid in further chromaticity calculations. To avoid unnecessary complication, we will concentrate on only thermal broadening and self-absorption. Since pressure (P) is proportional to temperature (T) in an ideal gas chamber of fixed volume V in thermal equilibrium - like the discharge burner of high pressure lamps, we can just assume only changes in T and see how these affect the lines' profile. The first modification therefore is to change the overall profile of all lines in the high pressure spectra into having a Lorentzian profile or even better a Voigt profile. For simplicity with calculations, we choose Lorentzian. A preliminary analysis for this is considered in the self-absorption for Sodium, which takes into account heat dissipation as a function of distance from the center of the arc in the arc tube. For further simplicity, we drop the heat dissipation function (the distance between center arc gas and arc wall gas is small) and we add one more assumption to the theory behind this change, which has been validated by experimental spectroscopy: That lines of higher intensity, degenerate faster into their high T Lorentzian profiles than low intensity lines at the same T(1). That is, intense lines are more prone to thermal pressure broadening and self-absorption, so we also change the sensitivity of lines to self-absorption: Experimental evidence suggests that lines of lower (relative) intensity suffer self-absorption at lower T rates than lines of higher sensitivity. We therefore denote as T1(3) the temperature of the discharge arc itself (in ° C), T2(2) the temperature of the arc discharge tube burner and T3 the radiation temperature (in ° K) of the blackbody contribution of the hot arc (denoted as K(°Celcius) below).
We obtain thermal data for calibration of the Lorentzian profile and we finally model the line profiles as LorentzianLine(T1)(broadened emission)-LorentzianLine(T2)(less broad absorption)(2)+Blackbody(T3)(thermal//black body emission) for the line intensities throughout the lamp spectrum. [5] provided the author with some thermal data in private communication along with data for Black body contribution for high temperature Hg, Na and MH hot gas arcs. Combined with data from [3] and [60], we have the following table:
| Discharge burner (source(s)) | T1 (°C arc body) | T2 (°C arc tube) | T3 (°K blackbody arc contrib.) |
| HPM([5][3][60]) | 5200-5600 | 600-850 | K(5300)-K(5800) |
| MH([5]) | 4400-5000 | 800-900 | K(4600)-K(5300) |
| HPS([5]) | 4000-4400 | 1150-1200 | K(4100)-K(4500) |
| HPX([3][60]) | ~2000(+)/~10000(-) (see [47] here) | 500-700 | ~K(6000) |
Follow some spectra of the discharge lamps above recalculated using the new data for the Lorentzian line profile and by varying the Ti parameters:
| Lamp Type | CIE chromaticity CCT (K) |
Source Color | Spectral Distribution |
|
High Pressure Mercury Clear T1=300, T2=180, T3=K(300) [*] Black body contribution (mostly) insignificant Slight broadening of Mercury lines Compare with lamptech and [1.4.1] [*]: T1/T2/T3 in real lamps can vary according to Discharge burner table above) and the calculations in this document are not exactly calibrated for the Ti data provided, so these are only numerically experimental examples indicative of that showing CCT and chromaticities matches only. For updated calculations with calibrated T3, consult MapleSoft where you can find Maple code that generates any of the graphs on this page. |
x=0.32175 y=0.40504 CCT:5849 |
 |
.jpg) |
|
Blended Light (fluorescent) T1=480[2*], T2=200, T3=2800 Black body contribution significant @2800K (raises T1 and T2) More intense thermal broadening of Mercury lines Note improved color relative to Clear Mercury Compare with lamptech and [1.4.5] [2*]: Same note as [*] above. T3 is close to true for the Tungsten filament in series with the arc tube in Blended Light lamps and the Black Body radiation from it is roughly calibrated against the intensity of the Hg lines, based on lamptech's spectrograph. |
x=0.38611 y=0.45067 CCT:4289 |
 |
.jpg) |
|
UHP Mercury T1=1100[3*], T2=250, T3=K(10000) Black body contribution significant @10300K (raises T1 and T2) Most intense thermal broadening of Mercury lines Compare with lamptech [3*]: T1 in real lamps can be anywhere between 2000-10000C (Discharge burner table above) depending on lamp-type and pressure and the calculations in this document are not exactly calibrated for Ti data, so this is only a numerically experimental example. |
x=0.28793 y=0.34251 CCT:7713 |
 |
.jpg) |
|
Tri-band (Na/Tl/In) Metal Halide[4*] T1=380, T2=200, T3=K(380) Black body contribution insignificant Partial thermal broadening of Na/Tl/In lines Compare with lamptech and [1.6.1] [4*]: A more accurate depiction than the one shown in section The Halide Discharge. [3] shows that this Metal Halide often contains Li as well and possibly traces of other elements. The exact amount of Li here was determined by comparing with lamptech and experimenting numerically with the ratios in the mix as shown on top of the spectrum graph. |
x=0.37505 y=0.50351 CCT:4689 |
 |
.jpg) |
|
Na/Sc Metal Halide[5*] T1=350, T2=200, T3=K(350) Black body contribution insignificant Partial broadening of Na D line Compare with lamptech and [1.6.3] [5*]: A more accurate depiction than the one shown in section The Halide Discharge. For Sc, [6] shows several lines around 673-683nm of dubious intensity (see section Possible NIST Inaccuracies). These lines were removed. |
x=0.35601 y=0.35204 CCT:4597 |
 |
.jpg) |
|
Kr/Th Metal Halide[5a*] T1=400, T2=200, T3=K(400) Black body contribution insignificant Partial broadening of Na D line Compare with [1.6.10] [5a*]: Similar to [5*] above, but with additional traces of Kr and Th. |
x=0.36482 y=0.34957 CCT:4272 |
 |
.jpg) |
|
Daylight (Rare Earth) Metal Halide[6*] T1=450, T2=100, T3=K(450) Black body contribution insignificant Partial broadening of Tl line Compare with lamptech and [1.6.4] [6*]: A more accurate depiction than the one shown in section The Halide Discharge. Contents may vary depending on type. [3] reports Dy, Tl and Cs. Other sources have reported Th and Ho as well. Contents and ratios for this one shown on the upper part of the spectrogram. In terms of intensity, compares better with the visual measurement of [1.6.4]. |
x=0.28292 y=0.44641 CCT:6903 |
 |
.jpg) |
|
Plant Growing Metal Halide[7*] T1=380, T2=320, T3=K(380) Black body contribution insignificant Partial broadening of Na/In lines and some self-absorption on In lines (reduced peak intensity) [7*]: A more accurate depiction of the one shown in section The Halide Discharge. Contents: Hg, Na, In and Li (but not Tl, as green does not contribute to plant growth). Not in production anymore (RADIUM). In terms of intensity, compares better with the visual measurement of [1.6.8]. |
x=0.31224 y=0.19496 CCT:N/A |
 |
.jpg) |
|
Iron Cobalt Diazo Metal Halide[8*] T1=350, T2=100, T3=K(350) Black body contribution insignificant No significant line broadening [8*]: A more accurate depiction of the one shown in section The Halide Discharge, with higher Ti's taken into consideration. Contents: Hg, Na, Co and Fe. In terms of intensity, compares fairly well with the visual measurement of [1.6.5]. |
x=0.29897 y=0.31992 CCT:7421 |
 |
.jpg) |
|
Lead Gallium Diazo Metal Halide[9*] T1=500, T2=350, T3=K(500) Black body contribution insignificant Some Pb lines broadened and self-absorbing [9*]: A more accurate depiction of the one shown in section The Halide Discharge, with higher Ti's taken into consideration, showing thermal broadening and self-absorption of the violet Pb lines. Contents: Hg, Pb and Ga. In terms of intensity, compares fairly well with the visual measurement of [1.6.6]. |
x=0.27821 y=0.30451 CCT:9440 |
 |
.jpg) |
|
Blue Metal Halide[10*] T1=500, T2=350, T3=K(500) Black body contribution insignificant In lines broadened and self-absorbing [10*]: A more accurate depiction of the one shown in section The Halide Discharge, with higher Ti's taken into consideration, showing thermal broadening and self-absorption of the blue In lines. Contents: Hg, In and Na. In terms of intensity, compares fairly well with the visual measurement of [1.6.7]. |
x=0.19816 y=0.11262 CCT:∞+ |
 |
.jpg) |
|
Green Metal Halide[11*] T1=500, T2=350, T3=K(500) Black body contribution insignificant Tl line broadened and self-absorbing [11*]: A more accurate depiction of the one shown in section The Halide Discharge, with higher Ti's taken into consideration, showing thermal broadening and self-absorption of the green Tl line. Contents: Hg, Tl and traces of Na. In terms of intensity, compares fairly well with the visual measurement of [1.6.9]. |
x=0.26837 y=0.62300 CCT:6560 |
 |
.jpg) |
|
Warm White Deluxe Metal Halide[12*] T1=550, T2=300, T3=K(550) Black body contribution mostly insignificant Tl and Na lines broadened and self-absorbing Compare with [1.6.2] [12*] This lamp also emits broadband molecular emissions, which cannot be simulated accurately. |
x=0.40833 y=0.50118 CCT:4096 |
 |
.jpg) |
|
Warm White Deluxe Metal Halide[12.1*] T1=550, T2=300, T3=K(550) Black body contribution mostly insignificant Tl and Sn lines broadened and self-absorbing Compare with lamptech [12.1*] Without Na. |
x=0.41979 y=0.47531 CCT:3779 |
 |
.jpg) |
|
Sodium discharge at medium pressure[13*] T1=500, T2=100, T3=K(500) Black body contribution mostly insignificant Na D line thermally broadened. Secondary lines intensifying Compare with [1.5.4] [13*]: During the warm-up phase of a high pressure discharge, at about half-time to total brightness. |
x=0.54799 y=0.42880 CCT:1926 |
 |
.jpg) |
|
High Pressure Sodium Discharge[14*] T1=1050, T2=900, T3=K(1050) Black body contribution mostly somewhat significant Na D line thermally broadened and self-absorbed. Secondary lines partially broadened Compare with lamptech and [1.5.5] [14*]: After full warm-up to total brightness. |
x=0.49294 y=0.44186 CCT:2514 |
 |
.jpg) |
| Super High Pressure Sodium White Lamp T1=3150, T2=3000, T3=K(3150) Black body contribution significant Na D line almost totally self-absorbed. All secondary lines broadened Compare with [1.5.6] and lamptech. Differences between spectral distributions due to changed behavior of hot Na gas, which behaves very much like a black body radiator at high temperature, rather than emitting a simple broadband spectrum. |
x=0.38960 y=0.43761 CCT:4150 |
 |
.jpg) |
| Pulsed Xenon High Pressure discharge T1=2500, T2=500, T3=K(6000) Black body contribution significant Most xe lines broadened Compare with [1.12.3]. Probably the best that can be done given the range of referenced T's in Discharge burner table, above. Using two separate data tables for the lines of Xe, one for low pressure and one for XeI-III, a Color Temperature of ~6300 (lamptech) was achieved at an average arc T1 of 2500 and T2 of 500, which according to [60] are the temperatures of the tip of the (+) electrode and the quartz envelope in these lamps. |
x=0.31640 y=0.31976 CCT:6363 |
 |
.jpg) |
NOTE: Calculations & results in all subsequent Sections do NOT take section 17. The Spectral Line Profile in High Pressure Discharges into account. All subsequent calculations are based on the raw (infinitely thin) spectra given in Sections 12. The Mercury Discharge through 16. The Xenon Discharge. The author is planning an update, with all results recalculated including lamps whose spectra feature thermal broadening and self-absorption, but one shouldn't expect too much of a difference (except perhaps for FS indexes), since the chromaticity values and CCTs for the new spectra are fairly close to the ones used in Sections 12.-16.
Here are the chromaticities of all the lamps discussed above plotted against the 1931 CIE diagram:
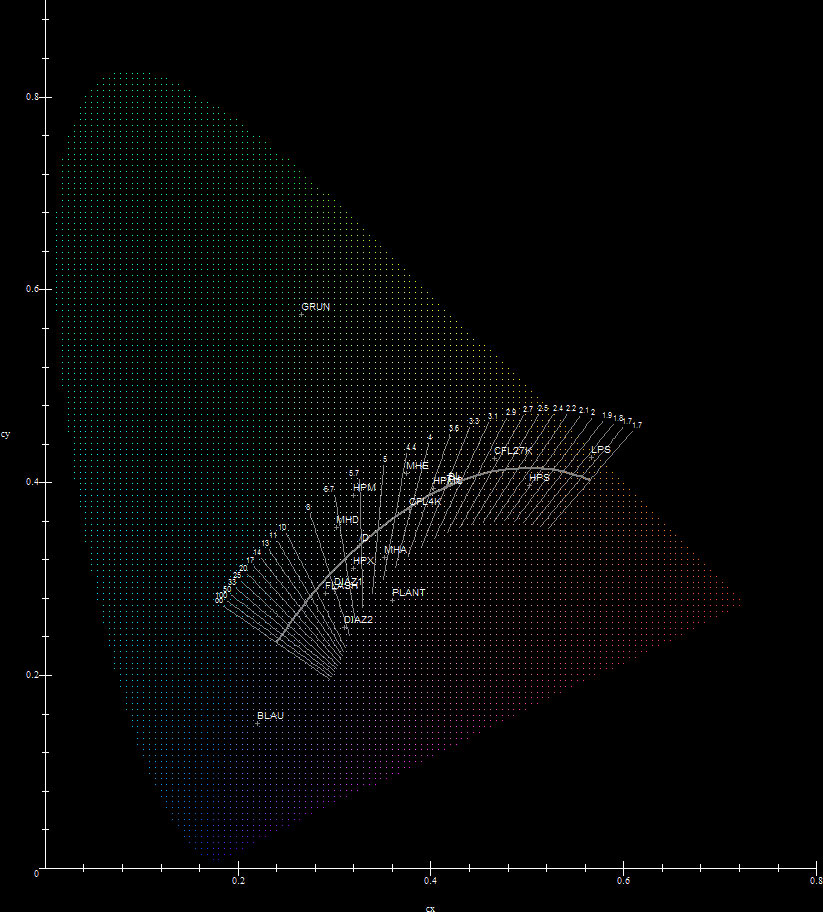
We now extract some crucial information from the data above. We consider a lamp L and the Black Body B of T=CCTL. Such a Black Body will lie exactly at the intersection of the Planckian Locus and the corresponding isothermal line. The geometric distance LB then, gives a measure of how well L approximates a Black Body of temperature equal to the lamp's CCT. On the other hand the distance LD gives a measure of how well L approximates D=Daylight:
We then call the lamp efficiency LE, the lamp lifetime LT and the lamp cost LC (sources for lamp efficiencies and lifetimes: [3],[5],[15],[16],[22],[23] and [25]. Source for lamp cost: personal data from lamps acquired). After the suggestion of source [36] the author has also included a lamp Full-Spectrum Color Index FS (see [34] and [37]-[39]). To have a more convenient form of data to work with the author first normalizes all the lamp/light data using the transformations:
| PCCT=100*(1-|CCT-TD|/(CCTmax-TD)) | PLB=100*(1-LB/LBmax) | PLD=100*(1-LD/LDmax) |
| PLE=100*LE/LEmax | PLT=100*LT/LTmax | PLC=100*(1-LC/LCmax) |
Accordingly then, PCCT is the proximity of the lamp/light's calculated CCT relative to TD=5785K, PLB is the proximity of the lamp/light to a Black Body of T=CCT relative to LBmin, PLD is the proximity of the lamp/light to D relative to LDmin, PLE is the lamp/light efficiency relative to LEmax, PLT is the lamp/light lifetime relative to LTmax, PLC is the lamp/light cost relative to LCmin and PFS is the lamp/light Full-Spectrum color index relative to an equal energy spectrum which has an index of 100. A plus sign on the PLB column should be interpreted as redder/greener/bluer than the color of the corresponding Black Body of T=CCT (depending on the source's CCT), while a minus sign should be interpreted as pinker/purpler than the corresponding Black Body, as indicated on the above diagram.
Here is all the data tabulated in order of presentation:
| Key | Light | CCT (K) | PCCT(1) | PLB | PLD | LE (lm/W)(2) | PLE | LT (kh)(3) | PLT(4) | LC (€/100W)(5) | PLC(6) | PFS(7) |
| TH | Tungsten Halogen | 3310 | 41.3 | 99.7 | 57.4 | 24 | 13.3 | 2 | 2.2 | 15 | 96.2 | 81.2 |
| D | Daylight | 5822 | 99.1 | 99.3 | 100 | 98 | 54.4 | ∞ | 100 | 0 | 100 | 99.4 |
| CFL27K | Triphos. Fluor. 2700K | 2724 | 27.3 | +93.2 | 35 | 65 | 36.1 | 12 | 13.6 | 80 | 80 | 35 |
| CFL4K | Triphos. Fluor. 4000K | 4031 | 58.3 | 98.7 | 74.9 | 75 | 41.6 | 12 | 13.6 | 80 | 80 | 63.4 |
| HPM | Mercury Vapor | 5942 | 96.2 | +78.9 | 79.9 | 52 | 28.8 | 24 | 27.3 | 25 | 93.7 | 49 |
| HPMC | Mercury Vapor Corrected | 3582 | 47.7 | +97.5 | 62.2 | 58 | 32.2 | 24 | 27.3 | 25 | 93.7 | 58.2 |
| BL | Blended Light | 3362 | 40.8 | +99.1 | 56.3 | 18 | 10 | 6 | 6.8 | 18 | 95.5 | 71.1 |
| MHE | European Metal Halide | 4366 | 66.3 | +82.9 | 65.3 | 78 | 43.3 | 18 | 20.5 | 120 | 70 | 51.1 |
| MHA | American Metal Halide | 4575 | 71.2 | -84.8 | 88.7 | 85 | 47.2 | 20 | 22.8 | 120 | 70 | 42.6 |
| MHD | Daylight Metal Halide | 6855 | 74.6 | +85.8 | 88.3 | 74 | 41.1 | 10 | 11.4 | 120 | 70 | 62.8 |
| PLANT | Plant Metal Halide | 3629 | 48.8 | -55.3 | 73.9 | 62 | 34.4 | 4 | 4.5 | 130 | 67.5 | 66.5 |
| BLAU | Blue Metal Halide | ∞+ | 0 | 41.1 | 17.2 | 20 | 11.1 | 2 | 2.2 | 130 | 67.5 | 8.8 |
| GRUN | Green Metal Halide | 6748 | 77.1 | 0 | 4.4 | 88 | 48.8 | 6 | 6.8 | 130 | 67.5 | 0 |
| DIAZ1 | Diazo 1 Metal Halide | 8051 | 46.2 | -94.1 | 79.4 | 25 | 13.8 | 0.6 | 0.6 | 140 | 65 | 10.8 |
| DIAZ2 | Diazo 2 Metal Halide | 8377 | 38.5 | -79.4 | 66.3 | 23 | 12.7 | 1 | 1.1 | 140 | 65 | 0 |
| LPS | Low Pressure Sodium | 1784 | 5 | +90.6 | 0 | 180 | 100 | 12 | 13.7 | 100 | 75 | 0 |
| HPS | High Pressure Sodium | 2104 | 12.6 | -91.4 | 27.2 | 100 | 55.5 | 22 | 25.1 | 140 | 65 | 4.6 |
| FLASH | Xenon Flash | 9050 | 22.5 | -95.8 | 76.3 | 25 | 13.8 | 50 | 57 | 200 | 50 | 94.6 |
| HPX | High Pressure Xenon | 6225 | 89.5 | -93.6 | 90.3 | 40 | 22.2 | 2 | 2.2 | 400 | 0 | 75.5 |
Selecting a particular lamp for general or specific lighting is a difficult choice even for professional lighting engineers. There are several factors which come to play and these factors are more or less related to CCT, LB, LD, LE, LT, LC and FS. To make the issue even more confusing, lighting depends on distance, application, space, place, population density and on hundreds of other factors which are usually analyzed extensively in college architecture courses. Architects, additionally, deal with the extra factor of aesthetics which is also important in most public space applications. In general, architectural treatises (such as [23]) separate the course material into a first technical section which is common between them and lighting engineers and describes most known artificial light sources and then delve into the optics and engineering of specific private or public places. In this section the author uses multiple objective optimization to derive some interesting conclusions. This kind of optimization is used whenever there are several conflicting objectives which must be optimized simultaneously. The objectives here are optimal values of CCT, LB, LD, LE, LT, LC and FS. When n different (and possibly) conflicting objectives are present, the researcher examines some value functions Fn(m) associated with each item m and each objective n, and looks at the consumer/user/application preferences. These preferences correspond to n weights wn which assign each objective n an "importance" factor. Then the researcher, for each item m tries to maximize S(m)=∑k=1..nwk*Fk(m). It is immediately obvious that while each Fn(m) may well have a well-defined minimum and maximum for a specific n (when item m varies), S(m) will depend on the weights wn. In general Fn(m) are normalized so that their ranges are similar, otherwise S(m) may end up biased. In this example, we have n=7 objective functions: F1(m)=CCT(m), F2(m)=LB(m), F3(m)=LD(m), F4(m)=LE(m), F5(m)=LT(m), F6(m)=LC(m) and F7(m)=FS(m), where m is the lamp/light type. We have normalized the ranges of all the objective functions such that 0≤Fn(m)≤100, via the normalization transforms above, so there is no bias on the objective functions relative to each other. All we need to do now is assign the weights wn and look at the ratios S(m)/Smax. To save space, we denote the weights for a particular application as the array [w1,w2,w3,w4,w5,w6,w7]. Here the author chooses seven testing and ten typical applications, along with the overall performance as follows:
Here are then the scores S(L) of lamp/light L the Maple program generated for the test applications A(1)-A(7). The optimal choices for each application are indicated in parentheses, with best=1, worst=18. The top four choices are highlighted in magenta:
| L/A | CCT | LB | LD | LE | LT | LC | FS |
| TH | 43.9 (12) | 95.6 (2) | 57.6 (13) | 20.1 (15) | 12.9 (14) | 92 (2) | 79.1 (3) |
| D | 100 (1) | 100 (1) | 100 (1) | 64 (2) | 99.9 (1) | 100 (1) | 99.9 (1) |
| CFL27K | 30.1 (15) | 88.6 (9) | 36.7 (15) | 40.3 (9) | 20.2 (10) | 76.4 (7) | 36.9 (13) |
| CFL4K | 59.7 (8) | 95.4 (3) | 73.8 (8) | 47.6 (7) | 23.3 (8) | 78.3 (6) | 64.1 (7) |
| HPM | 93.8 (2) | 78.2 (15) | 78.7 (5) | 36.1 (12) | 35.2 (3) | 91 (4) | 51.8 (11) |
| HPMC | 50.1 (9) | 94.2 (5) | 62.5 (12) | 38.6 (11) | 34.1 (4) | 90.2 (5) | 59.2 (9) |
| BL | 43.2 (13) | 94.9 (4) | 56.6 (14) | 16.8 (18) | 16.3 (12) | 91.1 (3) | 69.9 (5) |
| MHE | 66.3 (7) | 81 (14) | 64.8 (10) | 48.6 (6) | 28 (7) | 69 (11) | 52.5 (10) |
| MHA | 71.2 (6) | 83.1 (13) | 85.9 (3) | 52.9 (4) | 30.7 (5) | 69.5 (9) | 45.4 (12) |
| MHD | 74.2 (4) | 84 (12) | 85.7 (4) | 47.3 (8) | 21.5 (9) | 69.5 (9) | 63.6 (8) |
| PLANT | 49.7 (10) | 55.6 (17) | 71.7 (9) | 39.3 (10) | 13.6 (13) | 65.9 (12) | 65.4 (6) |
| BLAU | 2.69 (19) | 39.3 (18) | 17.9 (17) | 13.4 (19) | 6.02 (19) | 62.3 (16) | 10.5 (15) |
| GRUN | 72.4 (5) | 3.71 (19) | 7.58 (18) | 50.2 (5) | 11.3 (16) | 63.2 (13) | 3.71 (19) |
| DIAZ1 | 46.8 (11) | 89.1 (8) | 75.6 (6) | 19.1 (16) | 9.29 (17) | 63 (14) | 15.2 (14) |
| DIAZ2 | 39 (14) | 75.2 (16) | 63.4 (11) | 17.1 (17) | 8.33 (18) | 62.1 (17) | 4.76 (18) |
| LPS | 9.67 (18) | 85.5 (11) | 5.11 (19) | 99.9 (1) | 19.2 (11) | 71.3 (8) | 5.14 (17) |
| HPS | 16.4 (17) | 86.2 (10) | 29.2 (16) | 57.9 (3) | 28.4 (6) | 62.5 (15) | 9.18 (16) |
| FLASH | 27.4 (16) | 92.5 (6) | 74.7 (7) | 21 (14) | 58.3 (2) | 51.5 (18) | 91.4 (2) |
| HPX | 86.4 (3) | 89.8 (7) | 86.5 (2) | 28.2 (13) | 12.4 (15) | 6.74 (19) | 73.7 (4) |
Here are also the scores S(L) of lamp/light L the Maple program generated for the actual applications A(8)-A(18). Again, the optimal choices for each application are indicated in parentheses, with best=1, worst=18. The top four choices are highlighted in magenta:
| L/A | Home | Work | Street | Cinema | Public | Alert | Growth | Astro | Diazo | Photo | Overall |
| TH | 81.7 (3) | 72 (5) | 40 (14) | 60 (10) | 70.5 (9) | -75.1 (11) | 76.2 (3) | 74.6 (8) | -33.9 (13) | 69.8 (6) | 59.9 (9) |
| D | 100 (1) | 99.6 (1) | 99.9 (1) | 100 (1) | 99.9 (1) | -112 (17) | 99.9 (1) | 93.5 (2) | -99.5 (17) | 100 (1) | 99.9 (1) |
| CFL27K | 73 (7) | 52.4 (14) | 53.8 (11) | 34.1 (15) | 49.8 (15) | -19 (5) | 51.8 (13) | 78.4 (5) | -27.6 (11) | 35.2 (14) | 49.1 (13) |
| CFL4K | 79.9 (6) | 73.5 (4) | 60.6 (5) | 68.4 (6) | 78.4 (6) | -72.4 (9) | 67.3 (6) | 66 (11) | -17.7 (8) | 69 (7) | 66.1 (4) |
| HPM | 80.3 (5) | 71 (6) | 58.9 (8) | 76.6 (4) | 77.1 (7) | -121 (18) | 59 (10) | 79.6 (4) | -123 (18) | 64.2 (9) | 69.6 (2) |
| HPMC | 83.1 (2) | 70.4 (7) | 60.2 (7) | 58.3 (11) | 70 (10) | -62.9 (6) | 69.3 (4) | 84.9 (3) | -20.3 (9) | 60.2 (11) | 64.2 (6) |
| BL | 81.3 (4) | 69.4 (9) | 38.5 (15) | 56.8 (12) | 68.4 (11) | -77.4 (12) | 68 (5) | 76.5 (7) | -28.2 (12) | 64 (10) | 58.3 (10) |
| MHE | 71 (10) | 63.7 (11) | 60.3 (6) | 62.5 (9) | 68.2 (12) | -67.9 (7) | 56.9 (11) | 60.6 (12) | -68.6 (15) | 58.1 (12) | 61.3 (8) |
| MHA | 72.8 (8) | 70.4 (7) | 65.4 (4) | 73.3 (5) | 80.2 (4) | -87.4 (14) | 54.6 (12) | 60.6 (12) | 6.86 (7) | 64.8 (8) | 65.6 (5) |
| MHD | 72.6 (9) | 73.9 (3) | 57.8 (9) | 78.8 (3) | 83.4 (3) | -96.8 (15) | 63 (8) | 52.4 (16) | -23.3 (10) | 75.2 (4) | 66.5 (3) |
| PLANT | 53.9 (17) | 62.6 (12) | 49.4 (12) | 65.8 (8) | 66.1 (13) | -67.9 (7) | 76.3 (2) | 50.9 (17) | 35.3 (4) | 70 (5) | 53.8 (12) |
| BLAU | 39.9 (18) | 26.4 (18) | 27.9 (18) | 11.3 (18) | 21.2 (18) | -5.07 (3) | 39.5 (15) | 69 (10) | 46 (4) | 12.8 (17) | 22.7 (19) |
| GRUN | 30.8 (19) | 14.9 (19) | 56 (10) | 21.4 (16) | 8.71 (19) | -13.2 (4) | 47.3 (14) | 73.8 (9) | -270 (19) | 2.92 (18) | 31.4 (18) |
| DIAZ1 | 69.4 (11) | 58.1 (13) | 33.1 (16) | 54.6 (13) | 71.6 (8) | -96.8 (16) | 17.2 (17) | 53.9 (15) | 84.8 (2) | 43.7 (13) | 47.5 (14) |
| DIAZ2 | 61.6 (15) | 48.4 (15) | 31.5 (17) | 43.4 (14) | 58.7 (14) | -79.6 (13) | 15.7 (18) | 58.5 (14) | 78 (3) | 31.8 (15) | 40.3 (17) |
| LPS | 68.1 (13) | 34.2 (17) | 96.8 (2) | 2.61 (19) | 24.6 (17) | 100 (1) | 60.9 (9) | 100 (1) | -46.4 (14) | 0.3 (19) | 43.5 (15) |
| HPS | 66.9 (14) | 42 (16) | 66.5 (3) | 19 (17) | 40.1 (16) | 21.4 (2) | 36.5 (16) | 78 (6) | 22.5 (6) | 15.6 (16) | 43.2 (16) |
| FLASH | 69.3 (12) | 77.3 (2) | 44 (13) | 68.1 (7) | 79.7 (5) | -74 (10) | 64 (7) | 35 (18) | 99.9 (1) | 85.6 (2) | 62.9 (7) |
| HPX | 56.2 (16) | 67 (10) | 23.3 (19) | 86.6 (2) | 88.9 (2) | -133 (19) | 11.9 (19) | -31.4 (19) | -88.2 (16) | 82.7 (3) | 57.3 (11) |
First, although the optimal choices for each application are numbered according to score for convenience, we need to qualify the numbering a bit. Here's a detailed table for the Home application, with the first row being S(D)-S(L), which is the score difference between D and the lamp L, and with the second row being the ratio of this difference to S(D)-S(HPMC), the optimal choice:
| L | D | HPMC | TH | BL | HPM | CFL4K | CFL27K | MHA | MHD | MHE | DIAZ1 | FLASH | LPS | HPS | DIAZ2 | HPX | PLANT | BLAU | GRUN |
| S(D)-S(L) | 0 | 16.9 | 18.3 | 18.7 | 19.7 | 20.1 | 27 | 27.2 | 27.4 | 29 | 30.6 | 30.7 | 31.9 | 33.1 | 38.4 | 43.8 | 46.1 | 60.1 | 69.2 |
| [S(D)-S(L)]/ [S(D)-S(HPMC)] |
0 | 1 | 1.08 | 1.11 | 1.17 | 1.19 | 1.6 | 1.61 | 1.62 | 1.72 | 1.81 | 1.82 | 1.89 | 1.96 | 2.27 | 2.59 | 2.73 | 3.56 | 4.09 |
The above table gives a measure of how "good" the rest of the choices are, relative to the optimal. For example, the 2700K triphosphor fluorescent, the American metal halide and the daylight metal halide are all roughly 1.6 magnitudes worse a choice than the high pressure mercury color corrected choice. Considering then the above numbers to one decimal place, the final practical ordering becomes:
| Home |
| D |
| HPMC, TH |
| BL, HPM, CFL4K |
| CFL27K, MHA, MHD |
| MHE |
| DIAZ1, FLASH, LPS |
| HPS |
| DIAZ2 |
| HPX |
| PLANT |
| BLAU |
| GRUN |
It's obvious that after a certain point, such as 1.7-1.8 orders of magnitude "worse" than the optimal choice (in this application), the choices displayed don't make very much sense, so all application results above should be interpreted accordingly. With the above assumption, here are the results:
The above analysis uses multiple objective optimization on the seven objectives CCT, LB, LD, LE, LT, LC and FS. The researcher may conceivably consider many more objectives, such as a "security" objective which may be related to how fast the lamps reach their full output, a "power-range" objective which is related to whether the lamp is available at a given wattage, or more specialized objectives such as "aesthetic appeal", "warmth", etc. Such additional objectives will eliminate certain choices which show up with high scores anyway. In the "Cinema/Studio" or "Public Gathering/Sports" applications for example, the objective "power-range" will eliminate triphosphor fluorescents and tungsten halogen lamps, since these either don't exist in sufficiently high powers, or when they do, they are grossly uneconomical to use.
The calculations and results of the above two sections are meant to be taken somewhat liberally. For example, there is no easy way to decide what constitutes a "balanced set" of weights w(n), for the n=1..7 objectives used in the calculations, unless all the weights are equal. For example, when one uses w(i)=200 and w(j)=1, does this really mean that the user/consumer preference for objective i is 200 times "stronger" than for preference j? Not really. What the Maple program shows is that given "sufficient" leverage on the weights to skew the user/consumer preferences sufficiently, the produced results are generally consistent with the general commercial/consuming trend. The general product trend is usually set by the major lamp manufacturers (who in turn rely on lighting engineers for research) and then is passed onto the consumer via appropriate advertising. Whether the trend catches on or gets dropped depends on additional factors, price notwithstanding. To make the issue more confusing, some trends catch on even without offering significant benefits. For example, the 2700K triphosphor compact fluorescent has been marketed as a considerable economical improvement over cheap incandescent lamps. The author hasn't tested ordinary incandescent lamps, but the results above show that the 2700K compact fluorescent is a worse overall performer than tungsten halogen lamps (score 13 vs 9 for tungsten halogen), even in the Home application itself! (score 7 vs 3). A much better overall performer than tungsten halogen lamps is the 4000K compact/triphosphor fluorescent (score 4 vs 9). However the general consumer usually has no idea of the difference, particularly in view of the fact that clueless distributors interchange the two kinds without discrimination. The end result is some consumers being benefited and some being suckered in, depending on which type they accidentally buy. This tends to happen less often with more expensive and larger power lamps, but it happens in this case as well.
People also get suckered in with the notion of "Full-Spectrum" lamp. Ever since the invention of the bi and tri-component phosphors (triphosphors) used in compact fluorescent lamps, hundreds if not thousands of rogue companies usurped the label "Full-Spectrum" for their own selling agendas, without regard to its actual meaning, selling lamps which they themselves call "Full-Spectrum" but which in reality do not differ from non-"Full-Spectrum" ones (see [41]). The latter is a deliberate attempt to con the consumer. It's not easy to calculate the 'Full-Spectrum' index which has been defined in [34] and used here, and under this advanced mathematical definition very few lamps are truly 'Full-Spectrum' lamps. For example and depending what percentage one considers a "cut-off" for "Full-Spectrum", the four winners in the FS column in the above table may safely be considered "Full-Spectrum" (Actual Daylight, Xenon Flash, Tungsten Halogen and High Pressure Xenon). If one lowers the "cut-off" percentage a bit, the Blended Light lamp may also be considered "Full-Spectrum" since one of its internal components is a radiating tungsten filament which is very close to "Full-Spectrum" (see FS index in the above tables and also [25]). The research on this page proves exactly this: That optimal lamp selection is complicated business depending on dozens of factors (the most crucial ones of which are used in the analysis above), best left to professional engineers or architects. If there was such a thing as a truly "Full-Spectrum" lamp, we'd all use that and be done with. As the reader can obviously see, that's not the case. Some lamps are better performers than others. There is no single light source whose light quality outperforms all the rest in all possible lighting applications, except the sun which produces Daylight. Nature has a knack for perfection and optimality...
If you are a private consumer who has been sold a lamp which was claimed to be a good performer for some reason or another or if you are a manufacturer/reseller of a particular lamp which you think is a good performer and you want the lamp to be independently tested and rated mathematically relative to the above lamps, you can email the author for details. You can specify additional criteria or objectives for the author to test, according to your likes, provided they can be mapped to reasonable mathematical values. After the lamp is tested, you can publish the results on your company's website or use them for whatever reason you deem appropriate.
References belong to two categories: Essential theory and advanced theory/applications. Essential theory references are provided in the form of direct links embedded in the text to avoid cluttering this section. The following advanced theory/application references are not sorted in any way of importance. They were simply added in no particular order as the author was building the page. The author is grateful to V.D. Roberts ([4]) for providing reference [7], to D.L. Klipstein ([5]) for T data on discharge tubes, to J.D. Hooker ([3]) for providing reference [8], to T. McGowan ([36]) for providing references [34], [35], [38] and [39] and to M. Rea for providing reference [37].