 |
 |
Left is always red, right is violet. Spectrum length varies according to picture. These are photos on black and white panchromatic film, which has a smoother response to most wavelengths. Wavelengths are nm on photos with the small spectroscope and Angstroms on photos with the Phasmatron spectroscope[1][3].
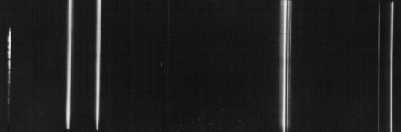
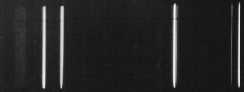
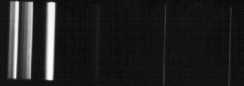
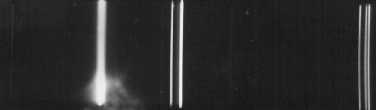
First the plain spectrum of a High Pressure Mercury Vapor Lamp taken with the small spectroscope. The European bulb that produced that was the OSRAM HQA 80W, with plain glass envelope. The line at the left is a red diode reference monochromatic emission at 660nm. The lines from left to right are: Two yellows (shown as one) at 5790.7A and 5769.6A, then the green line at 5460.74A, then the barely visible 4916.04 in the middle, followed by the triple blue 4358.35A and the two violet ones 4077.8A and 4046.56A. Note that the blue line resolves at an R~800.
|
|
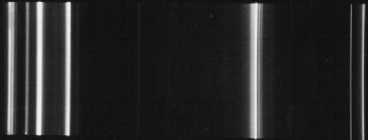
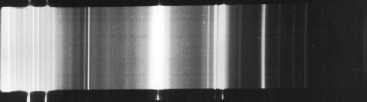
Next the spectrum of a color corrected High Pressure Mercury Vapor lamp, from an OSRAM HQL 80W with Yttrium-Vanadate phosphors. Note the additional emissions in the red part of the spectrum.
 |
 |
Follows the spectrum of a color corrected old Philips HPL lamp. The color correction and fluorescence is produced by an older mixture of phosphors (in production around 1960-70). The red fluorescent emissions are much weaker and deeper red.
 |
 |
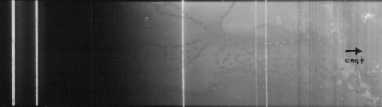
The next photo is the spectrum produced by the American Sylvania Metalarc/Super-Metalarc series (this is a 175W), which contains Mercury, Sodium and Scandium iodides. Sodium has almost started to self absorb (two strongest bands from the left - lines 2 and 4 from the left)[2]. Scandium shows at 5349.29A (7th from left) 4031.40A, 4030.66A, 4023.688A (6th, 5th, 4th from right), and the two UV lines at 3933.67A and 3911.810A (1st and 2nd visible from right).
 |
 |
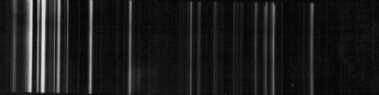
The next photo is the spectrum produced by the European equivalent of the Metalarc, the Philips HPI(T) (this one is a 2000W HPI-T) which contains Mercury, Sodium, Thallium and Indium iodides. Lines from left to right are: Sodium D1/D2 at 5895A, the Mercury yellow doublet, (2nd from left) the sodium 5688.224A (third from left) the Mercury green line (4th from left) then the Thallium 5350.46A green line which shows considerable banding here (5th from left), then the Indium blue at 4511.323A also banded (6th from left) followed by the blue Mercury weak line, followed by the Indium 4101.773A violet line (3rd from right) followed by the Mercury violet weak line, to end with the Thallium UV line at 3775.72A (rightmost, barely visible). This type of spectrum illuminates most of the public spaces here in Europe.
 |
 |
Next, the ever more popular triphosphor fluorescent low pressure Mercury Vapor lamp spectrum. Note the increased fluorescent band emissions and the weaker Mercury lines. The blue and violet Mercury lines to the right are barely visible. The three bands from left are red, yellow and green. This spectrum comes from the Philips Economic TL type.
 |
 |
Next photo is the spectrum of the actinic fluorescent tube TLAK 40W. It is more commonly known as a "bug killer" lamp. It is linear on Mercury's emissions, and contains a strong continuum around the 420nm v/UV area.
 |
 |
Next comes the spectrum of a Black Light High Pressure Mercury bulb. This one comes from the 125W HPW Philips Black Light. From left to right you see the blue Mercury triplet, the two violet ones and the triplet 3663.276/3654.833/3650.146A.
 |
 |
The last spectrum with the small spectroscope is an overexposed Mercury spectrum from a HQA 80W High Pressure Mercury vapor clear bulb, showing many additional lines. Note how many are in the UV area. The most intense UV line that shows right of the two violet ones is the 3801.66A line which is normally quite weak.
 |
 |
Next come the Phasmatron Spectroscope spectra. The first one is the red/yellow/green section of a color corrected High Pressure Mercury bulb. The lines are: First cluster from left, red fluorescence from Yttrium-Vanadate. Second cluster, Mercury yellow doublet (5790.7/5769.6A) and the green 5460.74A line. The magnification is 8x on the eyepiece.
 |
 |
Next, subsections of the above, at magnifications 16x and 24x. The left cluster on the left photo is again the Yttrium-Vanadate fluorescence, and the right cluster is the two yellow Mercury lines. The second photo shows only the yellow doublet, and if you look closely enough you will see self absorption taking place.
 |
 |
 |
 |
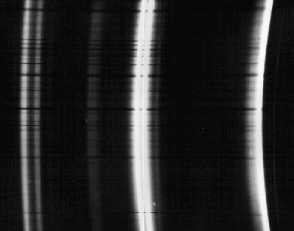
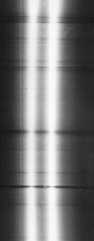
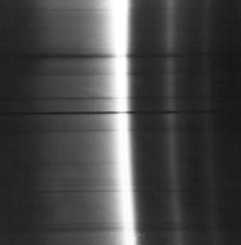
Next, the blue Mercury line 4358.35A at magnification 8x.
 |
 |
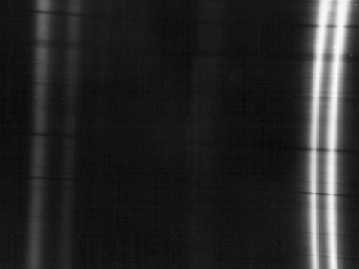
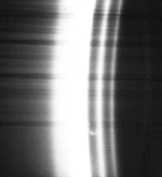
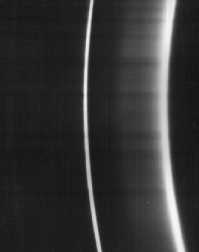
Finally, the blue 4358.35A triplet (wavelengths 4358.33/4347.49/4339.22) and the two violet (4077.81/4046.56A) Mercury lines, at magnification 24x. Note the self-reversal on the blue triplet[2]. The resolving power on the photograph on the top is around R = 50,000. (dλ/ds=1A/mm). On the bottom it is around R = 75,000.
 |
 |
 |
 |