 |
 |
Left is always red, right is violet. Spectrum length varies according to picture. These are photos on black and white panchromatic film, which has a smoother response to most wavelengths. All wavelengths are nm[1][2].
These are various other spectra which cannot be classified as they contain non specific constituents.
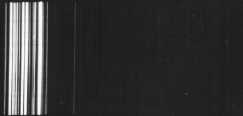
First, the spectrum of Neon. The source was a glow discharge Neon night bulb. The strongest line is at 5852.5A. The weak line after the cluster is at 5400.56A.
|
|
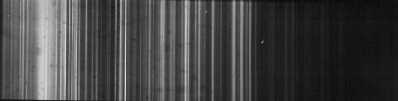
The next photograph is the spectrum of Xenon. In this case a strobo flash bulb was used, and the author left the shutter on for a while until he got the desired exposure. The lines are too numerous to list individually. The complexity of this spectrum is such that it successfully approximates Daylight.
 |
 |
Follow four Lithium exposures. A carbon arc was used (with Carbon electrodes taken from old big Berec batteries) and the Carbon rods were drilled and filled with LiCO, taken from Lithium depression prescription medicine. The first photo has been exposed correctly. The second and third are under exposed and the fourth is overexposed to show banding. The Lithium lines are at 6116.56A and 6103.6A (red, visible only in first photo far left), the two lines at 4982.12A and 4603.00A (visible on all photos at the center. Strongest line below and the weaker one to its immediate left) and the line at 4137.68A (last line in the middle/right decreasing sequence cluster). The molecular bands that show on the middle and violet section, are CN bands from various chemical reactions from the high temperature Carbon arc. These sequences are: Middle decreasing sequence (with the Lithium 4137.68A line at its right end) 4216A, 4197A, 4181A, 4168A, 4153A. The molecular CN band in the violet section (far right) is: 3884A, 3871A, 3862A, 3855A, 3850A.
 |
 |
 |
 |
 |
 |
 |
 |
The two next photos are Carbon arcs filled with chalk (CaCO3). The most prominent line of Calcium is at 4226.728A. Its position can be found by noticing its self-reversal in the second photograph (a bit to the right after the middle). Other Calcium lines like the 5349.47A are also visible. Compare these photographs with the previous ones for Lithium. Note the self reversal on the strong violet doublet as well in the second photograph.
 |
 |
 |
 |
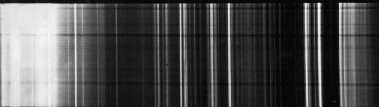
Next, the spectrum from the emissions of a color TV. Note that it is mixed with strong linearity towards the red from the emissions of the Cesium phosphors.
 |
 |
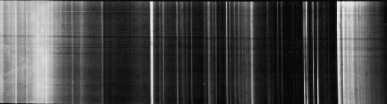
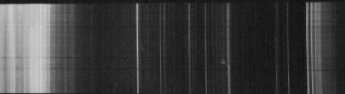
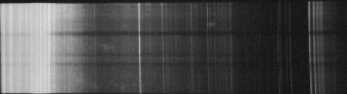
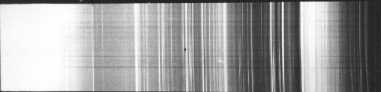
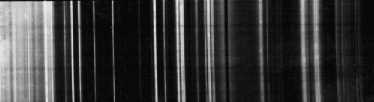
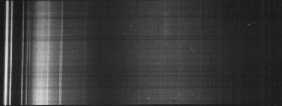
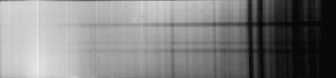
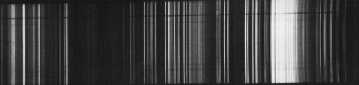
Next two spectra of the Sun. The first one is underexposed to show the Fraunhoffer lines in the visible area, and the second one is overexposed to show the ionized Calcium lines H and K at 3968.4A and at 3933.6A. No filter was used and the exposure was close to 1/60th of a second. Note the heavy absorption in the UV in general from various molecules. The first major absorption line left of the H line is the Hydrogen h line (4101.8A) and the second is the G line.
 |
 |
 |
 |
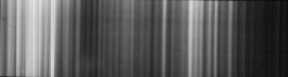
Next two quite peculiar spectra that try to approximate Daylight. The first is from the OSRAM HQI-T Daylight at 1000W. It contains Thallium (strongest line on the left section), and usually Dysprosium and Holmium. The second spectrum is produced by a carbon arc beck. The beck is the source that was used long time ago in cinema projection until it got replaced by compact source Xenon. The electrodes are made of Carbon, but are drilled and contain various salts in the center and they are encased in Copper sheathing, so all the Copper lines are shown. They need 30 Amps to operate successfully.
 |
 |
 |
 |
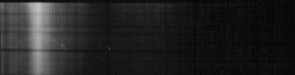
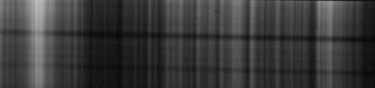
Finally, the spectrum of a plain Carbon Arc. Compare with the Li and Ca arcs above and see which lines are still present without any additives. When the tips of the electrodes of the Carbon arc are closer than 2-3 mms, the arc does not generate strong enough linear emissions and most of the energy is a continuum that comes from the thermionic emissions of the heated electrodes. The spectrum below was produced by separating the electrodes at a distance of 10mm or more to allow the arc to generate most of the radiation. All the bands are molecular CN and OH emissions, like above.
 |
 |