 |
 |
Left is always red, right is violet. Spectrum length varies according to picture. These are photos on black and white panchromatic film, which has a smoother response to most wavelengths. No attempt has been made to identify the lines, because they are too numerous[1][2].
All the following photos come from stainless steel electrode rods at 6 Amperes.
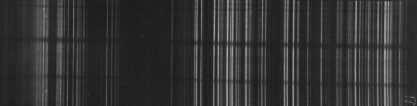
The first photograph is taken with the small spectroscope. The first major cluster in the left centers at 6102.15A. The area to the right goes as far as 3700A.
|
|
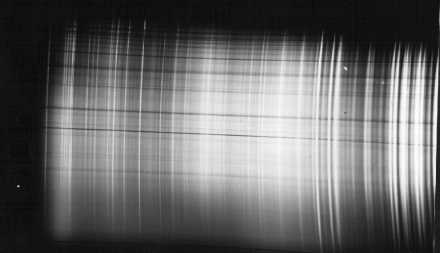
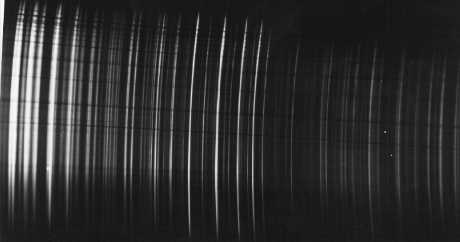
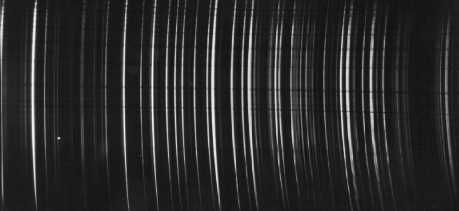
Next the same spectrum through the Phasmatron, at magnification 8x. The spectrum wraps to the left side of every other photo below. Compare with the spectrum above.
 |
 |
 |
 |
 |
 |
 |
 |
 |
 |
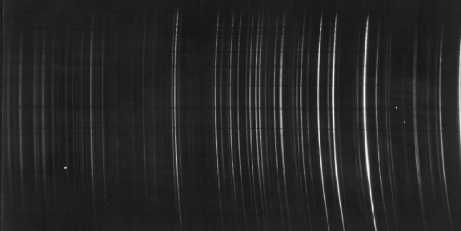
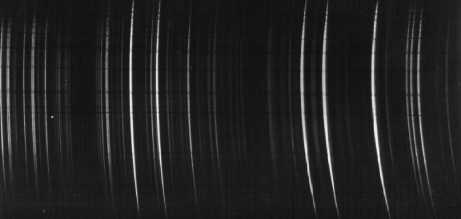
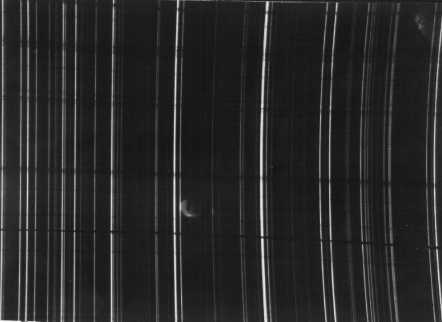
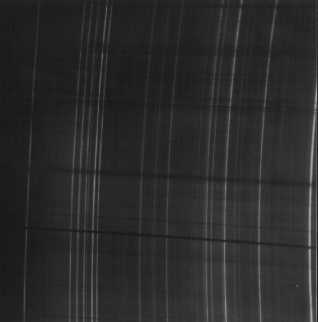
Next follow some spectrum parts from the above at magnifications 24x. The first one spans the area 5535.41A-5290.85A
 |
 |
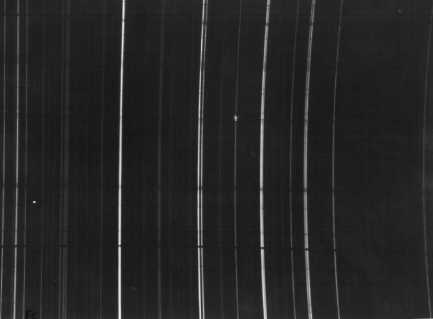
Next one is the third cluster from the left on the first photo. Note how many lines actually resolve. The resolution is around 2-3A/mm.
 |
 |
Finally, the red section in the beginning of the spectrum at magnification 24x. This section is visible at 8x in the 5 part section above.
 |
 |