 |
 |
Left is always red, right is violet. Spectrum length varies according to picture. These are photos on black and white panchromatic film, which has a smoother response to most wavelengths. Wavelengths are nm on photos with the small spectroscope and Angstroms on photos with the Phasmatron spectroscope[1][2].
All the photographs below were produced by two Copper rods made electrodes from films of pure Copper used in engraving.
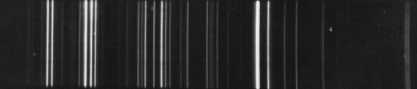
First, the spectrum of Copper through the small spectroscope. There are four major clusters of lines in the relatively simple Copper spectrum. The first cluster from the left are two yellow lines, the next cluster consists of four green ones (5292.52A/5218.202A/5153.235A/5105.541A) The most prominent line of the third cluster from the left is at 4530.8/4539.7A. The two relatively weak lines in the middle dark area are: 4378.20A and 4275.11A. Next come the very strong violet lines, at 4062.64A and 4022.66A (major doublet below). Then follow the UV with 3932.92A, a couple of more UVs and a strong UV emission doublet at 3629.79A/3610.81A, the last visible doublet to the right.
|
|
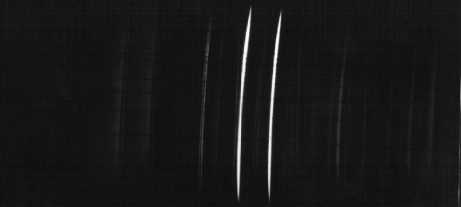
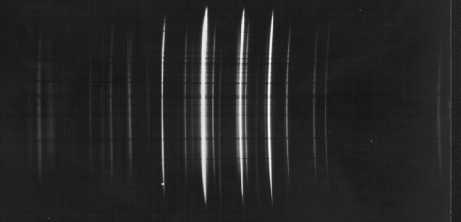
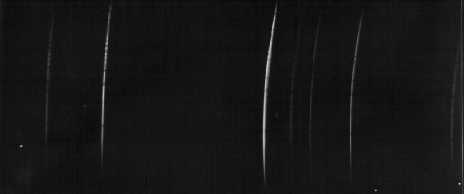
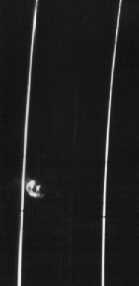
The same spectrum, as photographed through the Phasmatron spectroscope at 8x. The photos overlap from left to right to left below. Note the self-reversal on the first two lines below. The last line in the last photograph is the 4062.64A violet. Note that it not only resolves into two, but there is also self reversal.
 |
 |
 |
 |
 |
 |
 |
 |
 |
 |
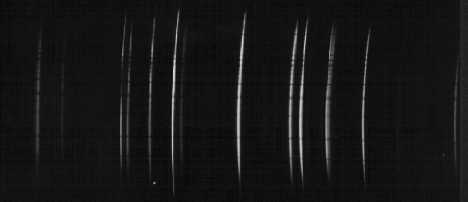
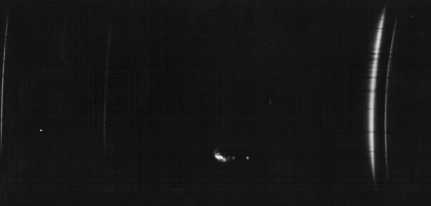
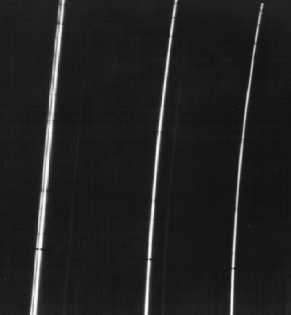
Next are the famous yellow doublet and green triplet lines at magnification 24x. The wavelengths on the bottom photo are from left to right: 5218.202A, 5153.235A and 5105.541A. You can deduce the resolution of the photo from that information. Note that the 5218.202A line is actually double.
 |
 |
 |
 |